Adding Observations
Observations you want to use with sensitivity analysis can be added in the 'Observations Section'
To add an observation, Select object type. This can a Channel, LSU, HRU or All Basin. Thus, you should select the type of object for which you have observations. Enter number of the object in 'Object Number' box. Browse and select the observation file by clicking the field where it says "Click to select an observation file".
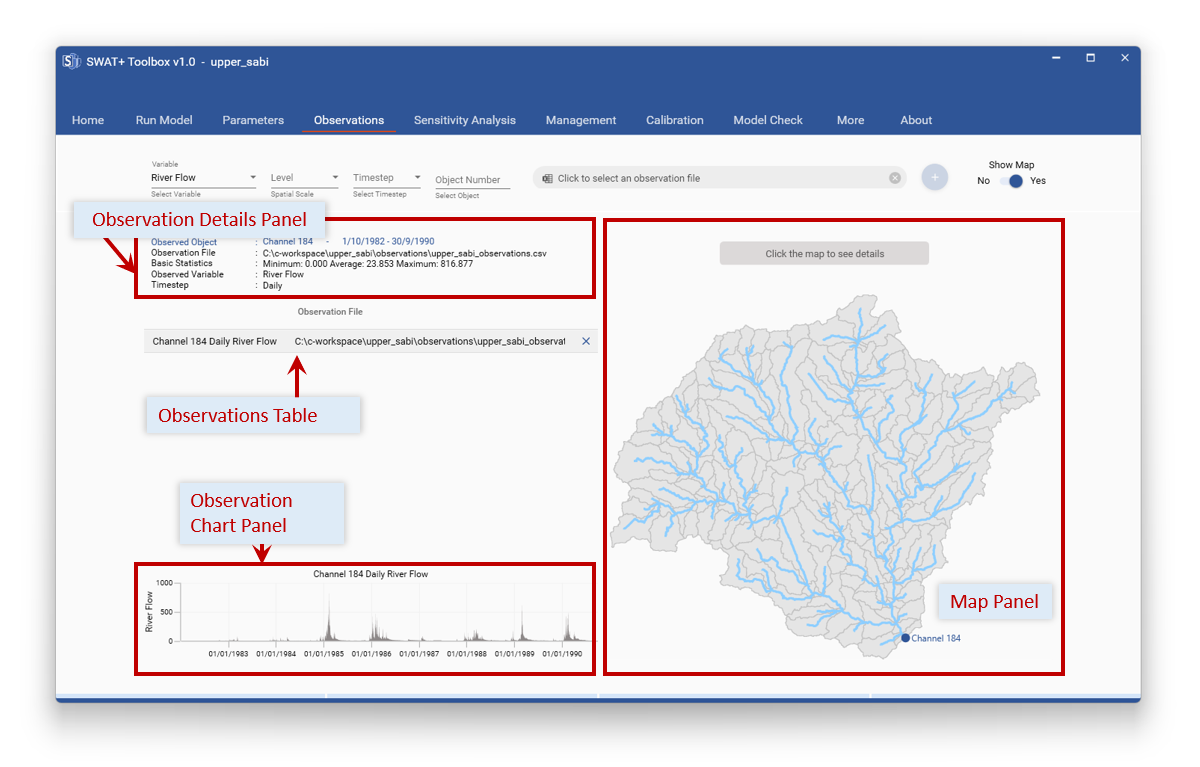
Fig. 8. Details of the Observations Section
The observation files should be in CSV format with two columns – date (dd/mm/yyyy) and value. The first row is not read and can be used as the row for headings. If you have missing data, use -99 in the place where you have missing data (any negative number should work). Select the timestep that your observations have. And select what variable the observations have.
As an example, Figure 13 presents what it would be like if you have daily flow observations for channel 206. Note that you can open the map to be assisted in choosing channel or LSU numbers by selecting the point on the map to obtain details. However, this only works if your TxtInOut is still in the initial project structure. When an observation is added, a quick plot is displayed in the Observation Chart Panel while more information is shown in the Observation Details Panel, including basic statistics. A point is also marked on the map to show where channel observations are.
You can cycle through details of added observations by selecting the corresponding observations in the Observations Table.
Note: You cannot add observation for the same object and same timestep and same variable twice.